I hit 2,000 sales through print on demand (POD) websites in May of 2021. Below is some data that I gathered about the 2,000 sales that you might find interesting.
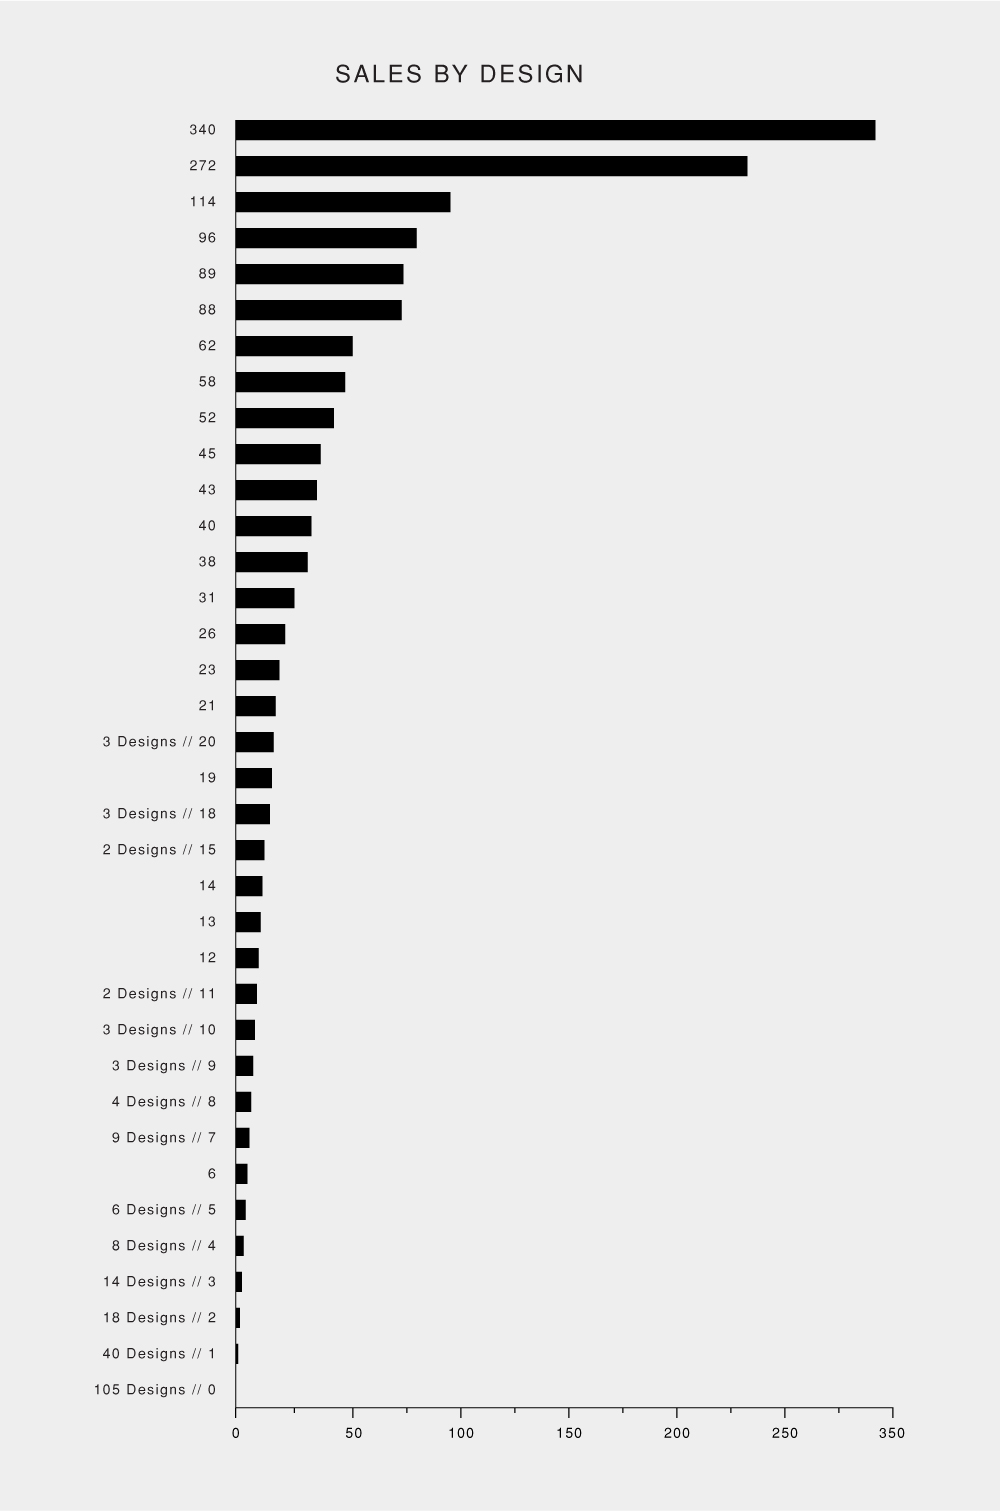
Sales by design
Most of my sales come from a few good designs. Some designs I thought would sell haven’t done anything and some designs I uploaded just for the hell of it have done quite well. I’m not good at predicting how a design will do. On average I have 8.26 sales per design.
% of designs with a sale
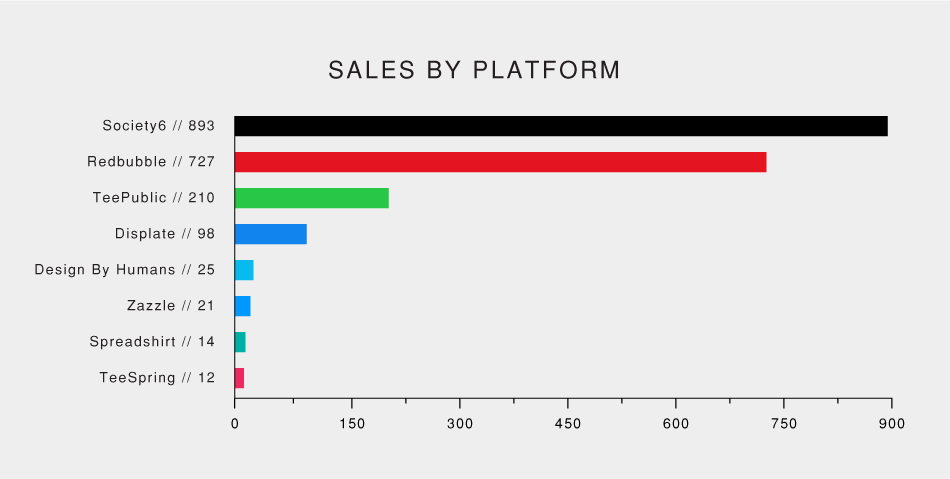
137 of 242 designs have sale or 56.61% of my designs have a sale. The percentage of designs with a sale on various print on demand sites varies from 38.56% on Society6 to 4.84% on TeeSpring.
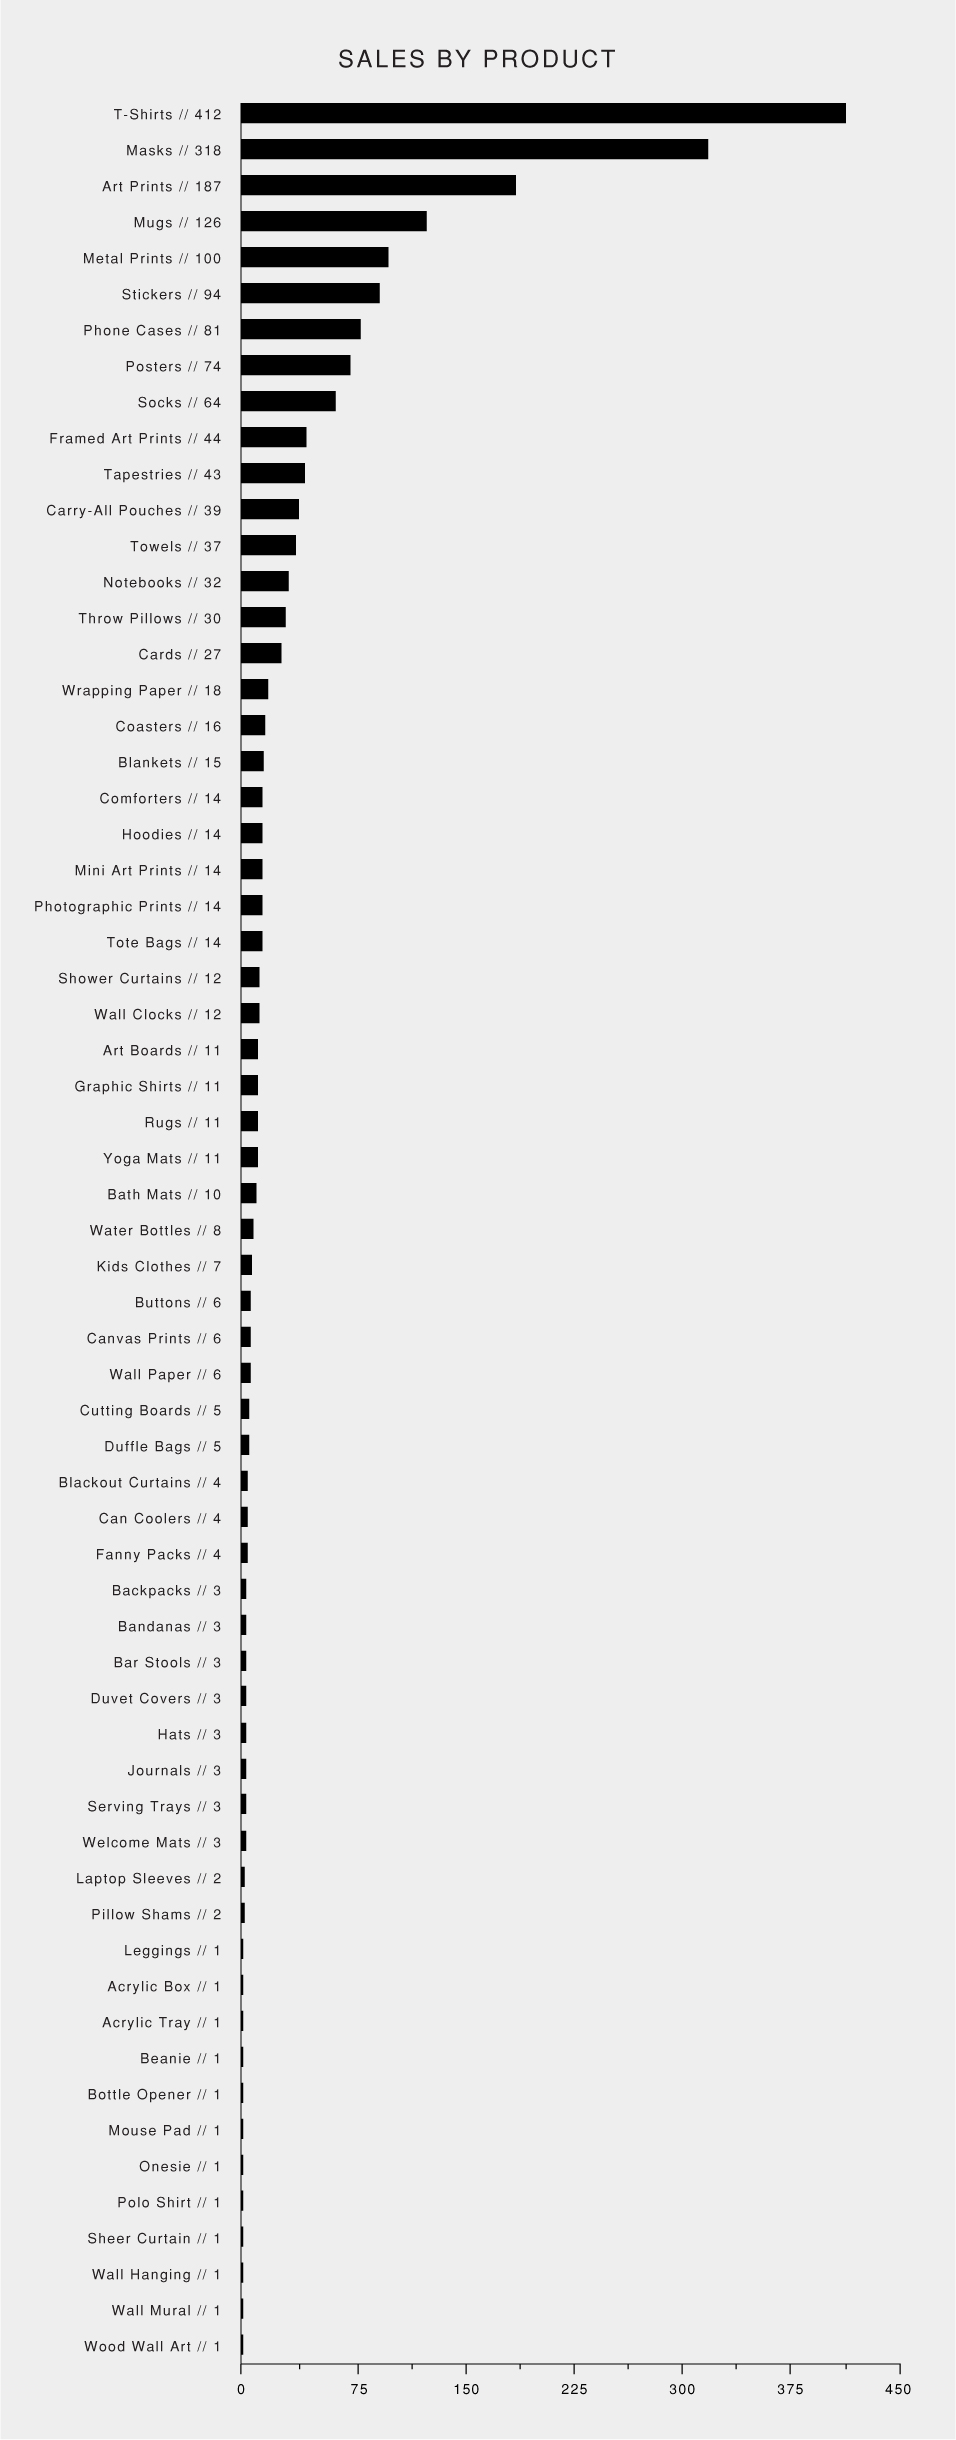
Sales by product
I’ve sold everything from backpacks to bandanas to coasters with my designs on them. T-shirts, face masks, art prints and mugs have made up more than half of my sales. The top 10 products make up 75% of my sales.
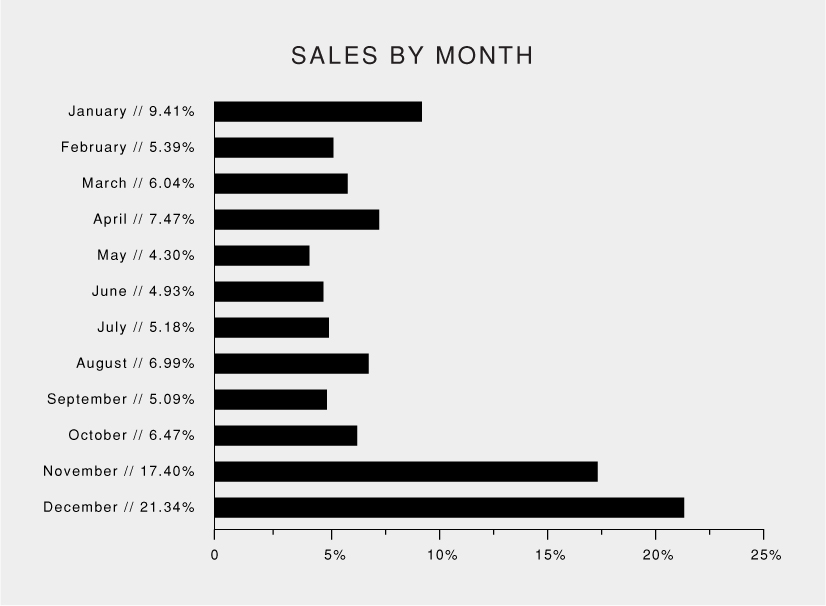
Sales by month
September through December account for slightly more than half of my sales. May is usually the slowest month. December is the busiest with November coming in second.
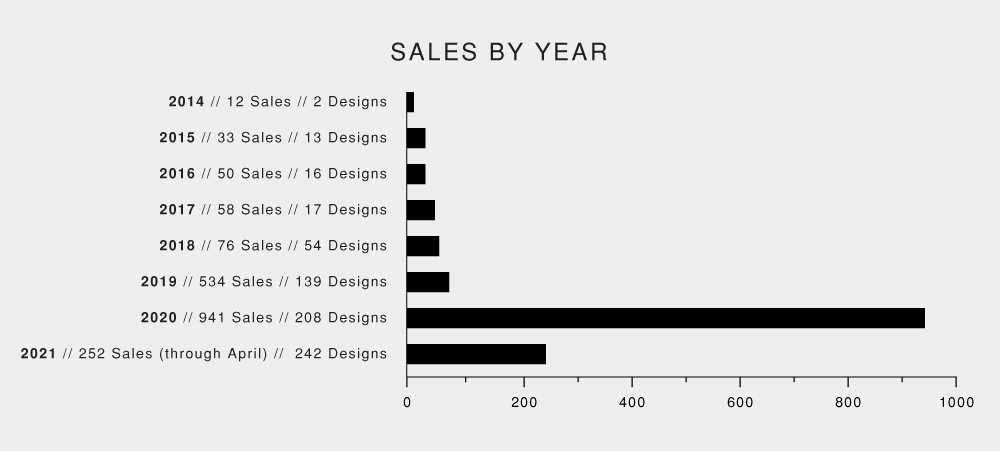
Sales by year with # of designs
Sales have increased over the last few years. I think the increase in sales has mostly been due to the increase in number of designs and the number of sites those designs have been uploaded to.
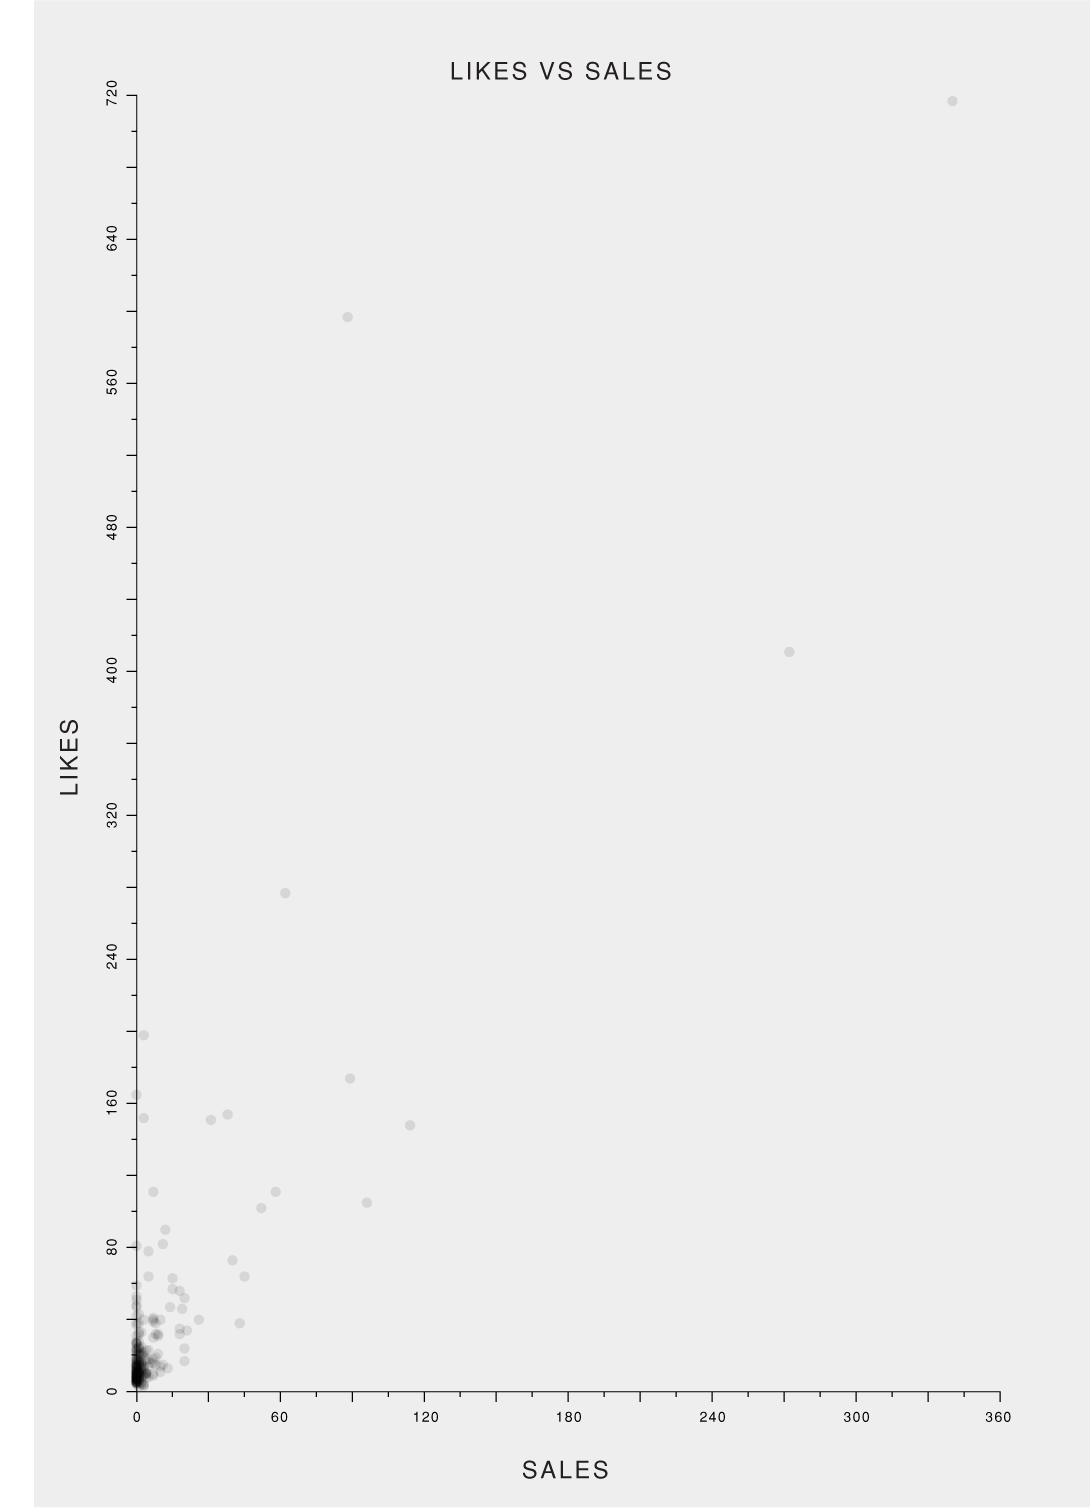
Likes vs sales
Society6 // 3198 likes / 893 sales = 3.85 likes per sale.
Redbubble // 4700 likes / 727 sales = 6.46 likes per sale.
The more likes you have on Redbubble and Society6 the more sales you will have. However that doesn’t always play out for individual designs. There are some designs that people like, but don’t want to buy for whatever reason. I have designs that have a 150+ likes, but no sales. I also have designs with two likes and two sales. ¯\_(ツ)_/¯